

CONOZCA EL MÉTODO DE MAPBIOMAS ALERTA
MapBiomas Alerta es un sistema que recopila alertas de diferentes sistemas de detección de deforestación en Bolivia, todos basados en sensores remotos. El procesamiento de este conjunto de alertas implica la agregación, validación y refinamiento de los límites espaciales basándose en el uso de imágenes satelitales de alta resolución, generando informes y publicando los resultados finales en una única plataforma de acceso abierto (https://plataforma.bolivia.alerta.mapbiomas.org/).
Esta sección proporciona una explicación simplificada de la metodología de procesamiento de MapBiomas Alerta. También destaca algunas limitaciones del método.
DESCRIPCIÓN DE LOS PASOS
El proceso de MapBiomas Alerta abarca los siguientes pasos: compilación, validación, refinamiento, cruce con datos públicos, auditoría y publicación de alertas y fichas de área deforestada (Figura 1).
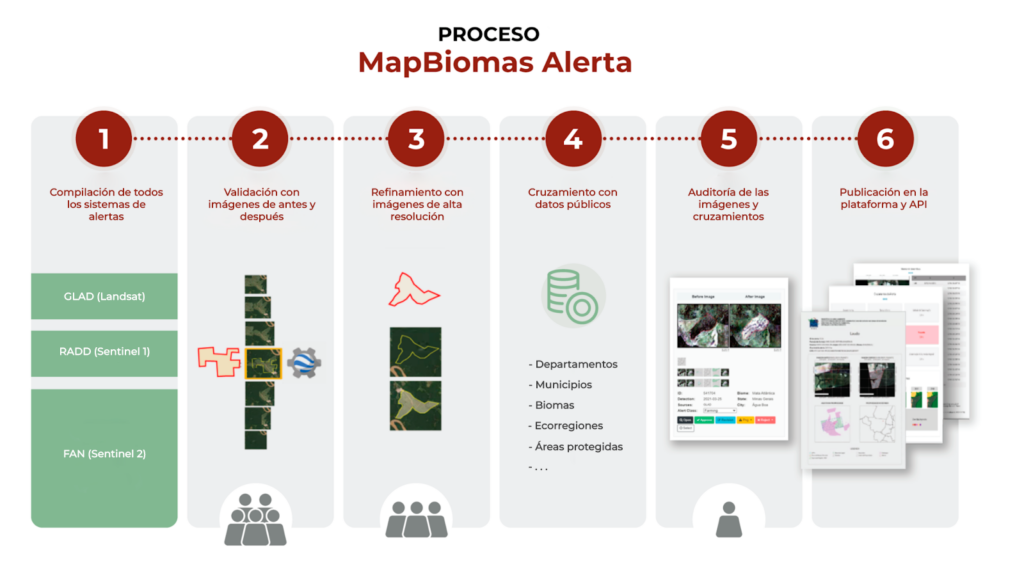
Figura 1. Proceso metodológico de MapBiomas Alerta Bolivia para compilar, validar, refinar, cruzar datos, auditar y publicar.
Paso 1: Compilación de alertas de sistemas existentes para todos los biomas de Bolivia.
MapBiomas Alerta reúne, organiza y consolida información sobre alertas de deforestación provenientes de sistemas de monitoreo independientes. Estos sistemas utilizan imágenes satelitales con resoluciones que van desde 10 metros hasta 30 metros para generar alertas de deforestación (Tabla 1).
Tabla 1: Sistemas y fuentes de detección mensual de deforestación utilizados por MapBiomas Alerta Bolivia
| Nombre | Fuente | Biomas | Enlace |
| GLAD-RADD | Maryland University | Amazonía, Chiquitano, Chaco, Pantanal, Tucumano Boliviano, Valles y Andes | https://glad.umd.edu/ |
| FAN | Fundación Amigos de la Naturaleza | Amazonía, Chiquitano, Chaco, Pantanal, Tucumano Boliviano, Valles y Andes | https://www.fan-bo.org/ |
Paso 2: Validación y selección de imágenes antes y después
El proceso de validación ocurre en dos etapas. La primera etapa es automatizada, eliminando todas las alertas de deforestación que ya han sido validadas, refinadas y publicadas en estudios anteriores. La segunda etapa se lleva a cabo mediante inspección visual por analistas capacitados organizados en equipos por bioma, apoyados por mosaicos mensuales de imágenes de alta resolución. En esta etapa, también se pueden descartar alertas que corresponden a falsos positivos, registrando debidamente la razón del rechazo (por ejemplo agricultura, estacionalidad, quemas, etc). Solo cuando la inspección visual confirma el evento de deforestación se considera válida la alerta. A partir de ese punto, se seleccionan dos imágenes satelitales: una imagen que muestra la cobertura forestal antes de la deforestación y otra que muestra el área después de haber sido deforestada. La adquisición de imágenes considera un área mínima de 700 por 700 metros, cubriendo tanto el área deforestada como sus alrededores para ayudar a contextualizar el evento de deforestación.
Paso 3: Validación y refinamiento en imágenes de alta resolución
Después de confirmar la deforestación asociada con cada alerta y seleccionar el par de imágenes de alta resolución, es necesario refinar los límites espaciales del área efectivamente deforestada. Este refinamiento se realiza mediante un proceso de clasificación automatizada que garantiza una mayor precisión en la definición de los contornos del área donde se ha eliminado la cobertura boscosa. La generación del polígono refinado se realiza utilizando un algoritmo de clasificación supervisada (Random Forest), que se procesa en la plataforma Google Earth Engine a través de Workspace, una aplicación desarrollada por MapBiomas para el procesamiento. La clasificación se realiza recolectando muestras de entrenamiento de las imágenes de alta resolución, tanto para representar el área deforestada como las áreas adyacentes no deforestadas. La clasificación final resulta en un polígono refinado que sufre un proceso de simplificación para eliminar el exceso de vértices (Figura 2). Con base en las imágenes antes y después de la deforestación, el intérprete también identifica y registra el vector de presión que pudo haber causado el evento de deforestación (minería, agricultura, expansión urbana, agropecuario, causas naturales u otros).
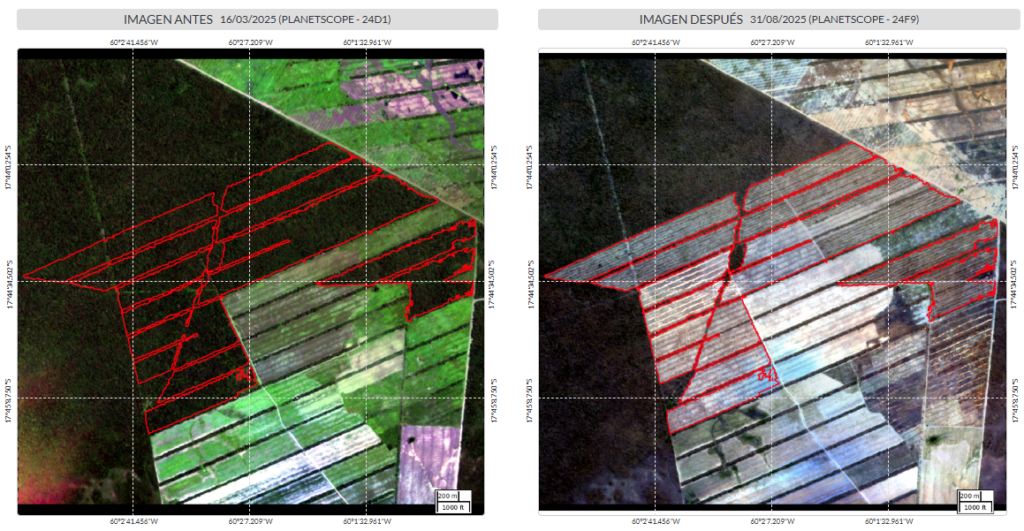
Figura 2. Ejemplo de imágenes Planet antes y después de la deforestación, junto con el polígono de alerta refinado (ID 30225969 de 2025).
Paso 4: Cruce con bases de datos territoriales públicas
Los polígonos refinados se superponen espacialmente con información espacial de la tierra y de vigilancia, incluyendo límites de: departamentos, municipios, biomas, áreas protegidas nacionales, áreas protegidas subnacionales, territorios indígenas, ecorregiones, sitios Ramsar, concesiones forestales y Tierras de Producción Forestal Permanente. Estos cruces califican las alertas y permiten la generación de fichas técnicas basadas en información relevante para las instituciones usuarias.
Paso 5: Auditoría
Cada polígono refinado pasa por un proceso de auditoría realizado por el supervisor técnico de cada bioma. En esta etapa, se evalúa la eventual necesidad de rehacer algunos ajustes antes de la publicación final de la deforestación confirmada.
Paso 6: Publicación
Todos los polígonos de deforestación confirmados se publican en la Plataforma MapBiomas Alerta Bolivia, con actualizaciones quincenales. Las fichas de áreas deforestadas están disponibles para cada deforestación confirmada con la siguiente información:
- Código de la alerta de deforestación;
- Área de deforestación;
- Fuente original de la alerta (sistema de detección);
- Departamento, Municipio y Ecorregión;
- Imagen y fecha de antes de la deforestación;
- Imagen y fecha de después de la deforestación;
- Superposición de la deforestación con: departamentos, municipios, biomas, ecorregiones, áreas protegidas nacionales, áreas protegidas subnacionales, territorios indígenas, sitios Ramsar, plan de desmonte y concesiones forestales;
- Historial de Cobertura y Uso del Suelo de MapBiomas Bolivia para el área evaluada.
- Historial de imágenes Landsat para el área evaluada.
- Fuentes de datos utilizadas en el cruce espacial.
Cancelación y Corrección de Alertas después de la Publicación
Bajo ciertas circunstancias, las alertas publicadas en la Plataforma MapBiomas Alerta pueden ser corregidas o incluso canceladas. Siempre que haya una indicación formal o una solicitud bien fundada que señale posibles errores asociados con las alertas, ya sea de agencias ambientales o usuarios de la plataforma, el equipo técnico lleva a cabo un nuevo análisis exhaustivo de estas alertas.
Este análisis se realiza revisando las imágenes disponibles, cuando es necesario, varias fuentes complementarias como imágenes de otros satélites (Sentinel, Landsat, etc.), imágenes satelitales de alta resolución disponibles en Google Earth, y el Mapeo de Cobertura y Uso del Suelo de MapBiomas. En los casos en que se confirma que la alerta publicada no corresponde a un evento real de deforestación o conversión de la cobertura boscosa (independientemente de la extracción de madera, legalidad o responsabilidad), la alerta es cancelada. Esto significa que se elimina del mapa y de las estadísticas de la plataforma, pero permanece en la base de datos para consulta individual a través de su código identificador único.
En algunos casos, se pueden llevar a cabo rectificaciones de delimitación espacial de la alerta, siempre con el objetivo de representar mejor el evento de deforestación en cuestión (Figura 3). De manera similar, si algún error o problema está relacionado con las imágenes vinculadas al polígono de alerta, se pueden seleccionar y actualizar nuevas imágenes en la plataforma. Todas las rectificaciones se registran en el sistema y la información se pone a disposición públicamente en la plataforma, incluida la fecha en que se rectificó la alerta.
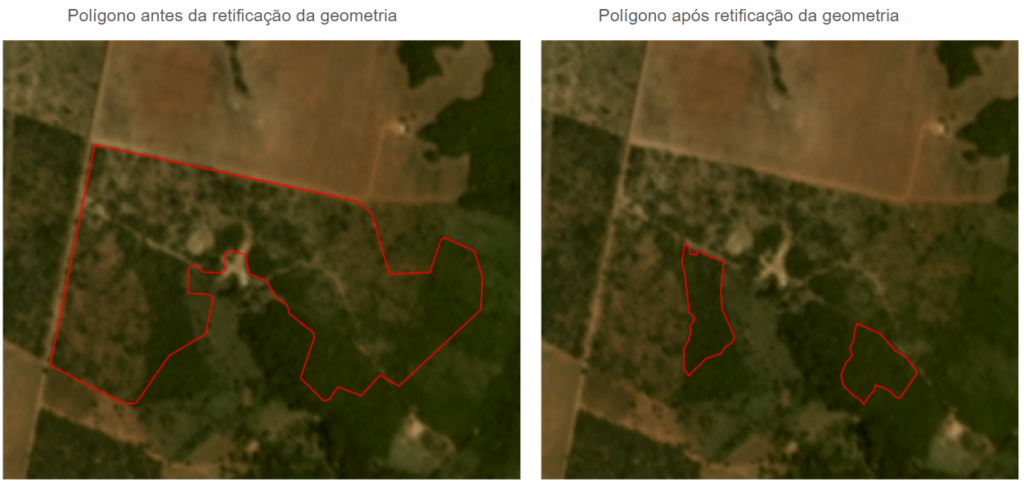
Figura 3. Ejemplo de rectificación de los límites espaciales de la alerta después de la publicación para el Código de Alerta 564078, detectado en el año 2022 (Brasil).
| La plataforma MapBiomas Alerta no analiza ni determina la legalidad o regularidad de las alertas de deforestación que presenta. La función principal de la plataforma es detectar y confirmar la pérdida de cobertura boscosa, independientemente de consideraciones legales o regulatorias. |
LIMITACIONES DEL MÉTODO
Como todo método, MapBiomas Alerta tiene algunas limitaciones que deben considerarse al aplicar sus datos:
- Tiempo de procesamiento: la importación de alertas desde sus fuentes (sistemas de detección) ocurre mensualmente. Dado que parte del procesamiento de las alertas se realiza individual y visualmente por analistas capacitados, el tiempo de validación y procesamiento depende del bioma y de la época del año. Puede variar de 30 a 90 días desde la fecha de detección por el sistema fuente hasta la publicación en la plataforma MapBiomas Alerta. El propósito de MapBiomas Alerta es aumentar la certeza sobre los datos de deforestación confirmados y proporcionar informes listos para la vigilancia remota. Las operaciones rápidas de vigilancia de campo dirigidas a la deforestación flagrante pueden planificarse directamente con los sistemas de detección preexistentes.
- Omisiones de Alertas: las deforestaciones se validan y refinan en base a la existencia de una alerta previamente capturada por un sistema de detección de deforestación de terceros. Las posibles omisiones de estos sistemas en la detección de deforestación también afectan a las alertas evaluadas por MapBiomas Alerta.
Para evitar omisiones, MapBiomas apoyó el desarrollo de Sistemas de Alerta de Deforestación (SAD) adaptados para cada bioma brasileño por varias universidades, instituciones de investigación y organizaciones de la sociedad civil. En base a la metodología “SAD”, en Bolivia se replicó y adaptó al contexto de nuestros bosques y biomas. Posteriormente se renombraron las alertas a (FAN).
También vale la pena señalar que los sistemas de monitoreo de deforestación presentan áreas mínimas de detección y, por lo tanto, pueden omitir alguna deforestación. Por ejemplo, las alertas menores a 0,3 hectáreas no se detectan con ambas fuentes (GLAD/RADD, FAN). La utilización de múltiples fuentes de datos para la misma región tiene como objetivo reducir las omisiones en la detección de deforestación.
- Velocidad de Deforestación Subestimada: al validar y refinar una alerta, se realiza una búsqueda de un par de imágenes satelitales de alta resolución de buena calidad de antes y después de la deforestación. La imagen “antes” es la más reciente disponible en el período de hasta 12 meses antes de la detección, y la imagen “después” es la más cercana al final de la deforestación. La presencia de nubes puede aumentar el período entre las imágenes antes y después por días, semanas e incluso meses. Esto no cambia la declaración de que la deforestación ocurrió en el período entre las dos imágenes, pero sí afecta el cálculo de la velocidad promedio a la que realmente ocurrió la deforestación.
- Delimitación Automática de Polígonos: los polígonos que delimitan las alertas refinadas se establecen mediante un proceso de clasificación automática del área de cambio entre las dos imágenes, es decir, el lugar donde se suprimió la cobertura forestal. Al delimitar el polígono de deforestación, se eliminan áreas con signos de cambio previo o con pequeños grupos de árboles que se mantuvieron en medio de la deforestación. En 2020, se desarrolló un procedimiento para minimizar las pequeñas islas dentro de los polígonos en la etapa de refinamiento, así como el exceso de vértices (que corresponden a los puntos que forman los polígonos).